
IMPERIX COCKPIT
REAL-TIME MONITORING SOFTWARE
Imperix Cockpit is a powerful monitoring software designed to facilitate the testing of power electronics systems by leveraging the capabilities of imperix programmable controllers.
The software provides a set of non-intrusive tools that support the easy monitoring and tuning of any control variable in real-time.
Cockpit is a Windows-based software included in both Software Development Kits (SDK).
You are here:
PILOT YOUR POWER CONVERTER
Cockpit allows research engineers to oversee the operation of their power converters and have a complete view of what is happening inside. The software provides multiple tools for both observing and acting on the run-time code. It is ideally suited for system debugging and testing in the power laboratory.
MAIN BENEFITS OF IMPERIX COCKPIT
- Full access to control variables: Monitor and tune any variable without rebuilding the code.
- Direct access to I/O signals: Capture analog input or PWM output data directly from the hardware, with over-sampling (B-Box 4 only).
- Advanced analysis: Evaluate performance using mathematical, statistical, and spectral analysis.
- Centralized management: Oversee all imperix controllers in the network – load and execute code, configure settings, manage multi-controller projects, all in one place.
- Remote analog I/O configuration: Check and modify the configuration live (B-Box 4 only).

Easily connect to the controller using 1Gbps Ethernet communication.

Monitor and tune any variable, and iteratively improve the control.

Apply transients and validate the system’s dynamic behavior.

Quickly and easily export results as MATLAB figures.
ONE SOFTWARE WITH MANY TOOLS
Cockpit provides centralized access to various monitoring and analysis tools, alongside convenient features to pilot and manage imperix programmable controllers in parallel setups.
The various tools can be conveniently rearranged within a dedicated space, allowing users to create their own interface, tailored to the needs of each power application.
TRIGGERED DATA CAPTURE

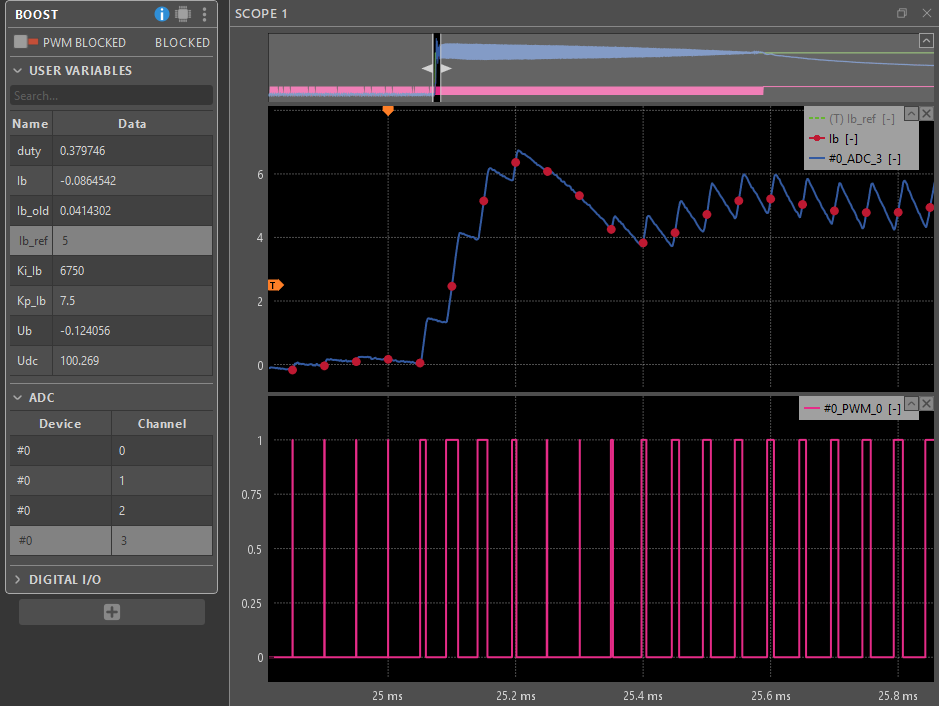
TRIGGERED SCOPING
The Scope displays acquired signals on an oscilloscope-like interface. It also includes cursors and statistical tools to measure phase shifts, periods, RMS values, and other relevant metrics.
Capture every sample of the control variables and monitor up to 800 000 points for 32 variables simultaneously.
Once you’re satisfied with the displayed results, easily export the data for quick integration into your documentation.
DIRECT ACCESS TO HARDWARE RESOURCES*
Cockpit can bypass the CPU and capture data directly from the controller hardware at the maximum possible rate, such as:
- Data acquired by the ADC inputs at 20 Msps*
- PWM outputs from the FPGA at 250MHz*
- GPI, GPO and FLT signals at 250MHz*
In Cockpit, these signals can be visualized alongside CPU variables, making it easy to see the exact sampling instant or that of any change to digital outputs.
Overall, with oversampling, you can see exactly what the controller sees, making it easy to analyze the effect of control discretization and to optimize its implementation.
*When running Cockpit with the B-Box 4.
TRANSIENT GENERATOR
The transient generator is designed to apply a predefined sequence of setpoints to any control variable.
Use it to challenge your control algorithms by testing their dynamic response or by applying specific test scenarios.

SPECTRAL ANALYZER
The spectral analyzer helps visualizing signals in the frequency domain and examine their harmonic content.
Assess your system’s performance and power quality with the built-in total harmonic distortion (THD) calculations.

FORMULA BUILDER
Perform mathematical operations on signals in real time and combine them to create new variables without recompiling the code.
Compare or combine your signals to extract useful information, such as instantaneous power, signal errors, power factors, and more.

OVER-SAMPLING
By combining all of its visualization and analysis tools with access to all of your control variables and raw hardware data*, Cockpit enhances your workflow and allows you to debug your system without the need to export data to other programs or to set up an oscilloscope.
- Examine the performance of your system by inducing a transient in your converter
- Inspect the quality of your waveforms and the spectral content of all of your signals by viewing your data in the Spectral Analyzer
With data captured directly from the hardware*:
- Uncover phenomena like aliasing, damping and ripple currents, which are invisible at the control rate
- Validate complex modulation schemes by combining PWM signals in the Formula Builder
*When running Cockpit with B-Box 4.

CONTINUOUS DATA LOGGING
The Rolling Plot tool displays your control variables sampled at a configurable rate. Choose a low sampling rate to monitor selected variables over several days, or a high sampling rate to capture every sample of your control variables.

Use it to monitor the long-term evolution of your power system and keep an eye on critical variables at all times.
It features a handy continuous autoscale option that ensures your monitored variables never go out of scope.
Additionally, the Rolling Plot tool supports data export to a CSV or MAT file, enabling further trend analysis and system optimization using MATLAB.
GUI BUILDER
The GUI Builder is a powerful graphical tool that allows you to create custom dashboards for interacting with their control code running on imperix controllers. For example, the following image showcases a dashboard designed for controlling and monitoring the motor included in imperix’s Electric Motor Drive Bundle.

Users can place a variety of widgets on a dedicated canvas to design tailored dashboards that fit their specific control applications.
Widgets can be linked to control variables, enabling real-time monitoring and modification of variables without requiring a rebuild of the control code.
A typical use case is shown in the Three-phase PV inverter example, which features a dashboard created with the GUI Builder to control the power converter.
REMOTE CONTROLLER MANAGEMENT
Imperix Cockpit supports managing multiple converter controllers directly over the network. Thanks to Ethernet communication and Ethernet over RealSync, users can manage, configure, monitor, and update several targets simultaneously.
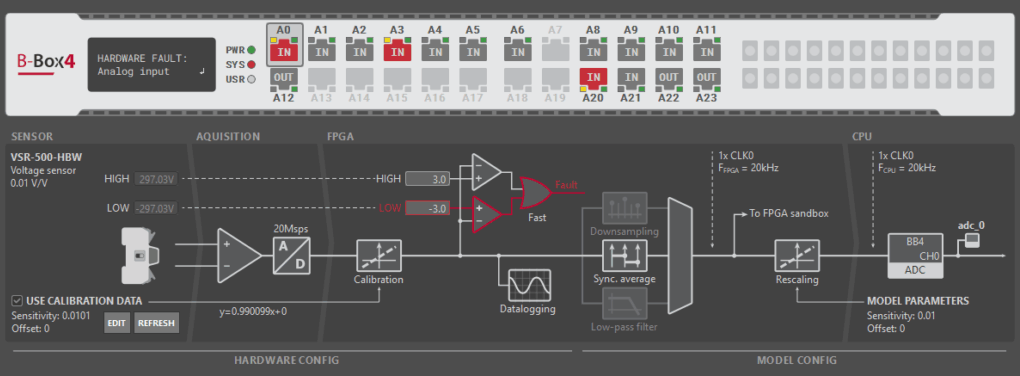
SET UP YOUR FRONT-END
On the B-Box 4, Cockpit provides a full overview of how your data is acquired, from the analog-to-digital conversion to FPGA and CPU post-processing.
Using the front-end view, you can remotely configure safety limits on every input channel and automatically detect and calibrate imperix sensors.

MANAGE YOUR CONTROLLERS
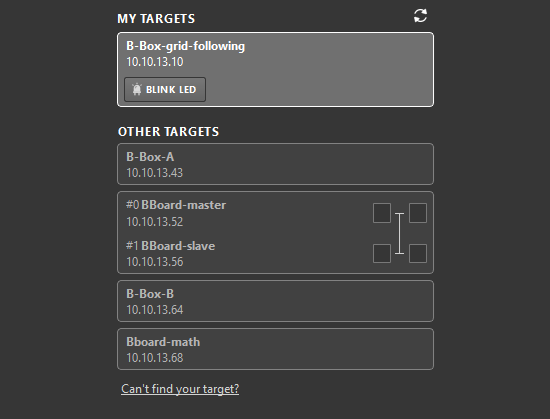
Cockpit provides a convenient interface that displays all your imperix hardware controllers, making it easy to identify, configure, and connect to them.
It simplifies the connection process for large applications involving multiple controllers, such as MMC systems.
Additionally, it supports multi-master operation for complex topologies requiring multiple controllers.

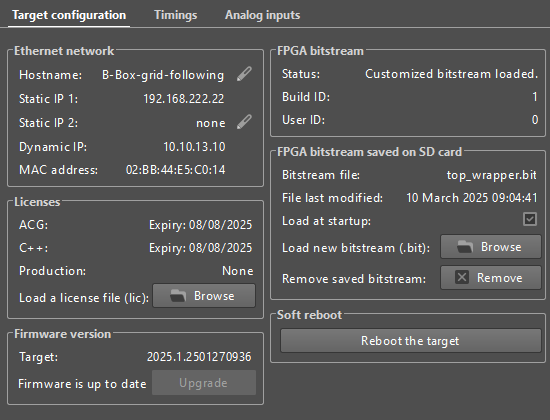
CONFIGURE YOUR CONTROLLERS
Configuring your controllers can be done in a simple fashion, such as changing the hostname or IP address, updating the firmware, managing the SDK licenses, etc.
The tool also configures the standalone boot mode, so that the controller can run without any computer.
Finally, from this view, you can also load a custom bitstream to the user-programable FPGA area.

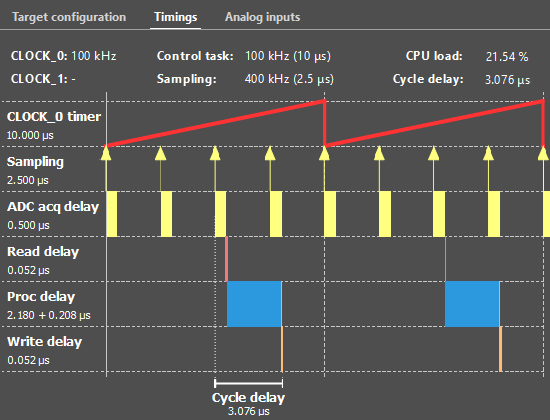
MONITOR YOUR CONTROLLERS
The Timing info provides a graphical representation of the computation and communication delays involved in imperix controllers during run-time.
Observe the delays involved in the control dynamics of your system and adjust the control parameters, such as Kp and Ki, accordingly.
TN167 is a typical use case where the knowledge of the control delay allows optimal tuning of a grid-feeding inverter.
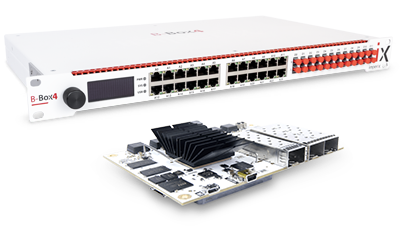
RELATED CONTROL HARDWARE
Cockpit is part of both software development kits (SDK) and can be used with any imperix hardware controller, namely the B-Box 4, B-Box RCP 3.0 and B-Board PRO.
In addition, it can be made available on any custom-built control hardware that is running BBOS, our real-time operating system.