Synchronous averaging is a measurement processing method that computes the average value of an analog signal over one full switching period. In contrast, synchronous sampling only takes one sample per period. This product note explores the differences between the two methods and how they can impact experimental results.
Synchronous sampling vs synchronous averaging
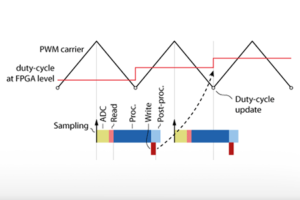
Synchronous sampling relies on the hypothesis that voltage or current ripples are perfect triangular waveforms. In this case, the average value of a ripple can be extracted by acquiring a single sample, taken at the right time, as illustrated below. This technique requires that the PWM pulses are symmetrical around the sampling instant, which only appears with triangular PWM carriers.
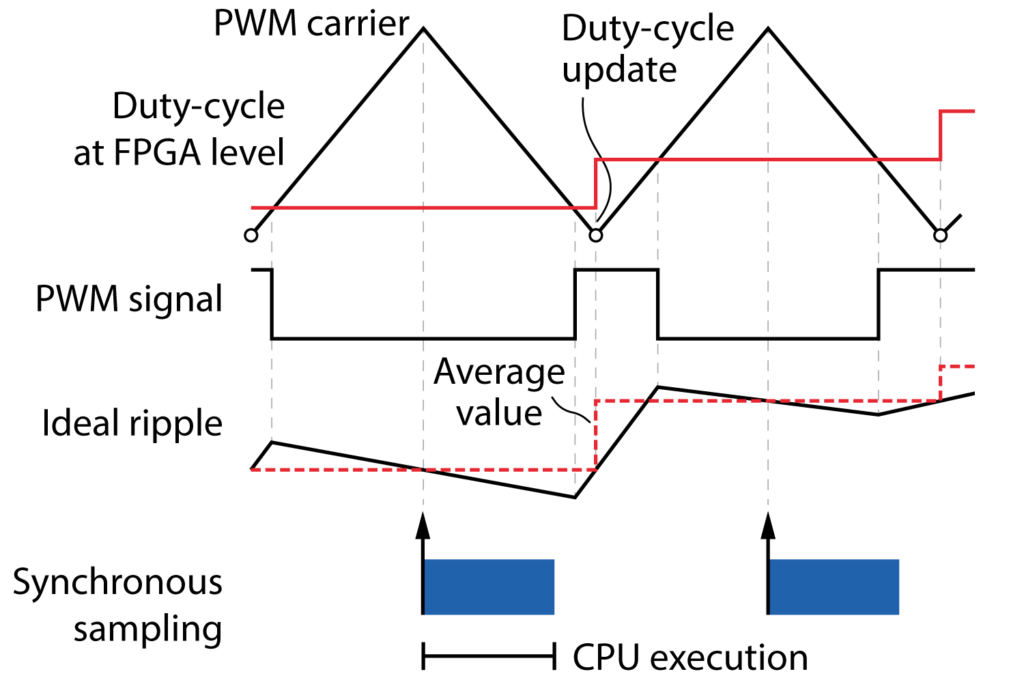
Unfortunately, this method is very sensitive to disturbances in the measured quantity (e.g. ringing effect) and to measurement non-idealities, such as noise, EMC disturbance, or non-linearity. As a result, synchronous sampling could measure a transient disturbance rather than the average value of the ripple. This is even more likely to happen when the modulation depth is close to 1, since the switching and sampling events are close to each other.
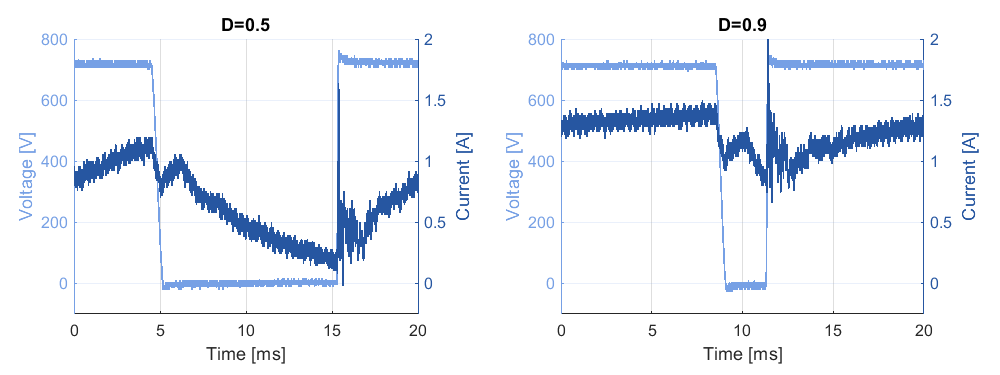
The figure below shows an example where the experimental current ripples are noticeably distorted after each switching event. One can observe that for a duty cycle of 0.9 (right plot), the sample taken in the middle of the PWM pulse (at 10ms) is right during a disturbance, and is far from the average current.
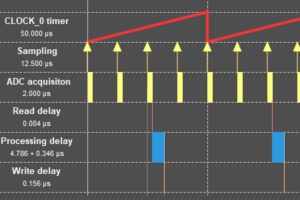
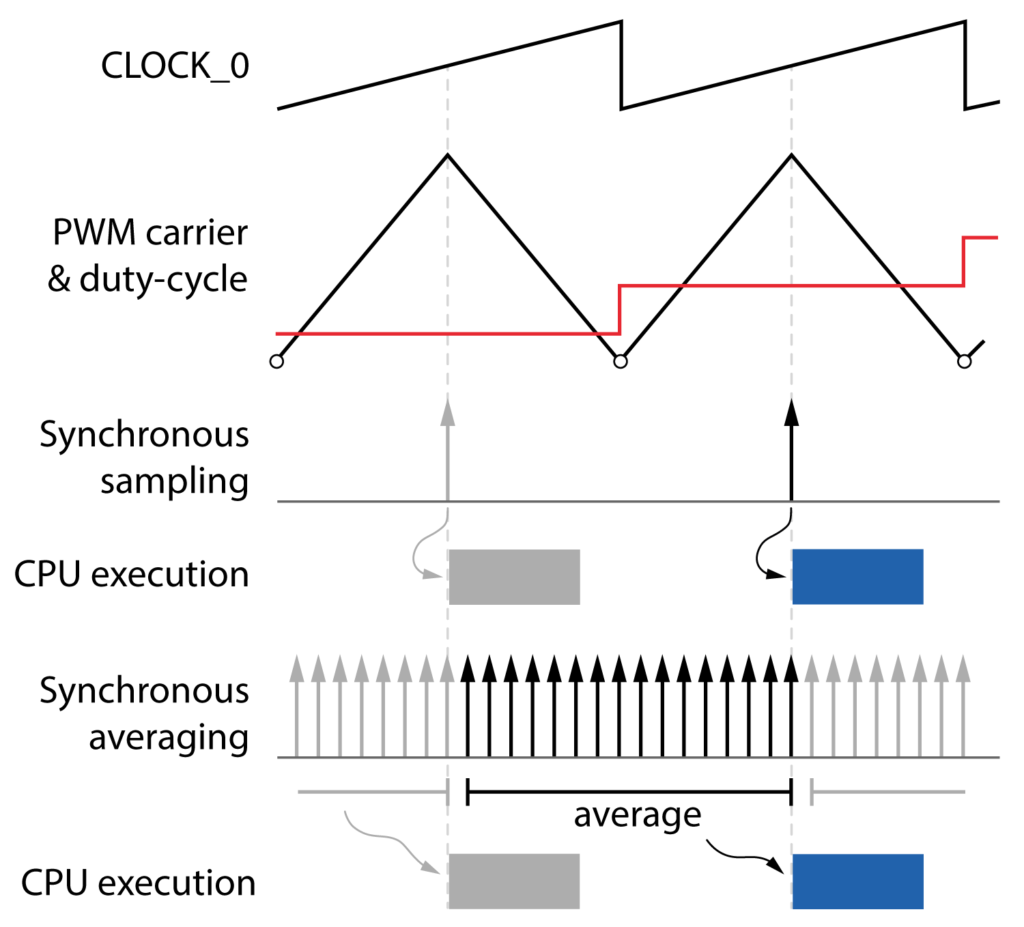
Synchronous averaging mitigates the effect of disturbances by taking several samples per period (in practice, as many as possible) and computing their average value. The averaging window has to be synchronous with the switching period, in order to extract the average value of the ripple. The figure below illustrates the difference between the two methods: both of them give the average value over a period of CLK0, but the time window used by synchronous averaging is shifted by half a period. From a control perspective, synchronous averaging introduces a half-period delay in the measurements.
How to enable synchronous averaging
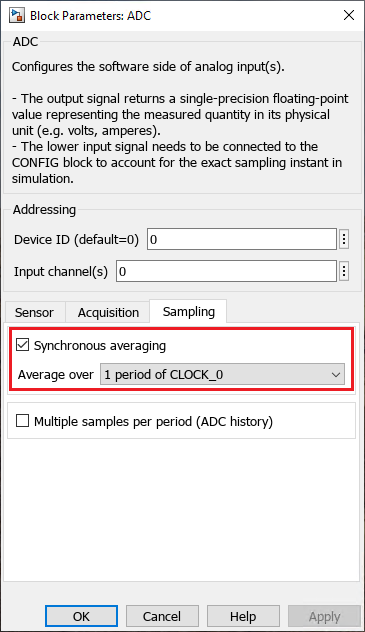
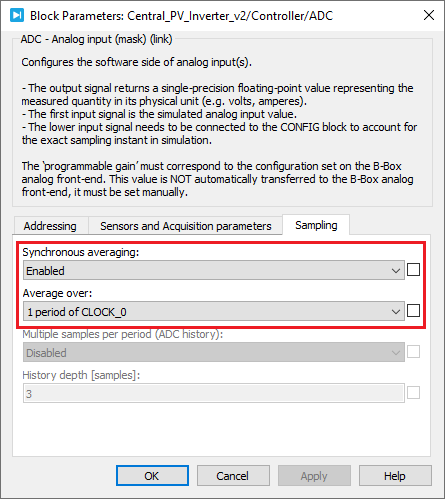
In Simulink and PLECS, open the mask of the ADC block and select the corresponding option, as illustrated below. In C/C++, the feature can be activated by calling the Adc_EnableSynchronousAveraging function in UserInit.
The latest SDK is available from https://imperix.com/downloads/.
Experimental results
The following test setup is used to compare the performances of the sampling methods. It consists of a PEB8038 half-bridge module supplied by a DC voltage source and connected to an RL load.
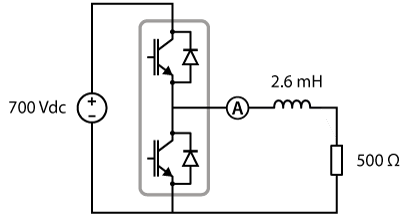
The experiment was carried out under deliberately challenging conditions to better illustrate how the sampling method can affect the measured waveforms:
- The open-loop control applies a sinusoidal voltage to the passive load.
- The DC bus voltage is set to 700 Vdc. The higher the DC voltage, the larger the oscillations due to ringing.
- The duty cycle oscillates in the [0.1; 0.9] range. As such, it comes close to 1.0 where synchronous sampling is particularly affected by distortions in the current.
- The output current is intentionally low (< 3% of the nominal range). In this situation, the amplitude of ringing oscillations and noise becomes significant with respect to the current ripple.
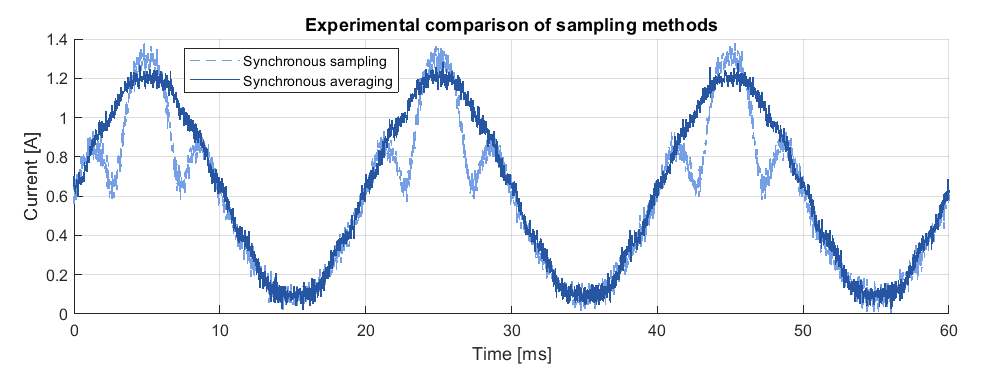
In theory, applying a sinusoidal voltage on a (mostly) resistive load should result in a sinusoidal current. In these challenging conditions, however, this is not what is observed with synchronous sampling (see the figure below). Distortions start to appear once the duty cycle exceeds 0.75. As explained above, this occurs because synchronous samples are taken immediately after a switching event, right in the middle of a transient disturbance.
By contrast, the current waveform obtained with synchronous averaging is much less subject to distortions. This illustrates how selecting the right sampling method can significantly improve measurement quality, particularly under demanding operating conditions.