Table of Contents
This article describes how to use the Spectral Analyzer of imperix Cockpit to interact with the user code running on imperix power converter controllers, namely the B-Box 4, B-Box RCP, B-Board PRO, the B-Box Micro, and the Programmable Inverter. This page provides a detailed explanation of all of its features, along with some usage examples.
For new users, it is recommended to read the following articles beforehand to get started with the imperix software development kit (SDK) and imperix Cockpit monitoring software:
Spectral Analyzer basics
The Spectral Analyzer window allows the user to examine Scope module variables in the frequency domain. This includes all of the user and math variables that are currently present in the module.
The window is fully dependent on the data acquired by the Scope Module. Closing the Scope will also close all opened Spectral Analyzers.
The Spectral Analyzer window is organized into tabs, each one corresponding to a plot area in the Scope module. The tabs can be switched through the bottom bar header. All tabs’ settings are independent of each other. To observe a variable in the Spectral Analyzer, add or move it to a Scope module plot area and it will show up in the corresponding tab. Conversely, moving or removing a variable from a Scope plot area will remove it from the corresponding Spectral Analyzer tab.
Spectral Analyzer interface
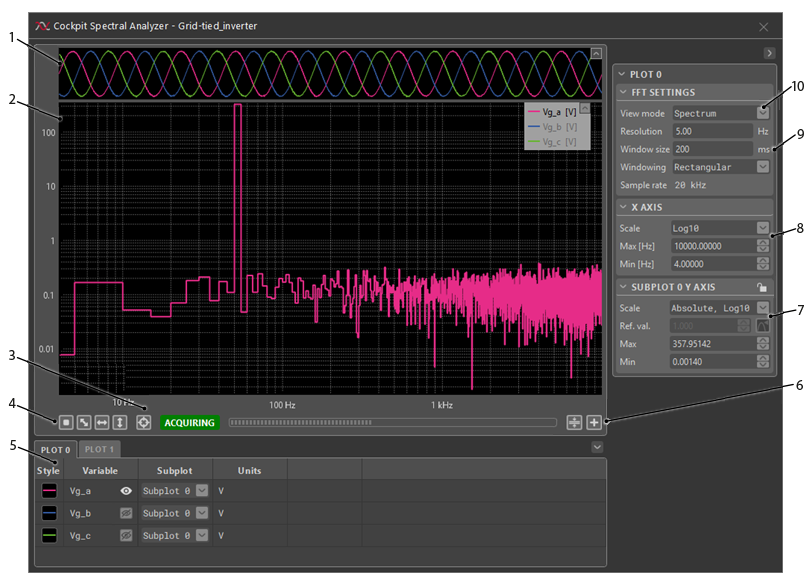
Calculating and displaying spectral content
In the Spectral Analyzer, the signal spectra are calculated using a variation of the Fast Fourier Transform (FFT) algorithm. Similarly to math variables in the Scope module, the calculations are performed on the PC side, after the acquisition of a scope window.
Spectrum mode
The Spectrum mode gives the best visual overview of the spectral content of the scoped signals. Since the widest window results in the highest frequency resolution, the default FFT window in this mode is the same as the acquisition window.
Technical details
The displayed frequency domain signal is the magnitude of the one-sided spectrum of the scoped variable, with the frequency range \(f \in [0, \frac{f_s}{2}]\). The Scope sampling rate, \(f_s\), corresponds to the control task frequency defined in the user code. The frequency resolution of the resulting spectra depends on the window in time over which the Fourier transform is performed and can be adjusted in the FFT Settings menu in the right bar.
Harmonics mode
In the Harmonics mode the spectral content is calculated with the same method as in the Spectrum mode, but is plotted in a way that makes it easier to visualize and compare the individual harmonics between of different signals. In addition to this, the Total Harmonic Distortion (THD) and Weighted THD (WTHD) metrics are calculated and updated in the bottom bar menu for the variables that are currently displayed in the plot. As is typical for the Power Electronics domain, the default FFT window is such that the frequency resolution is 50 Hz.
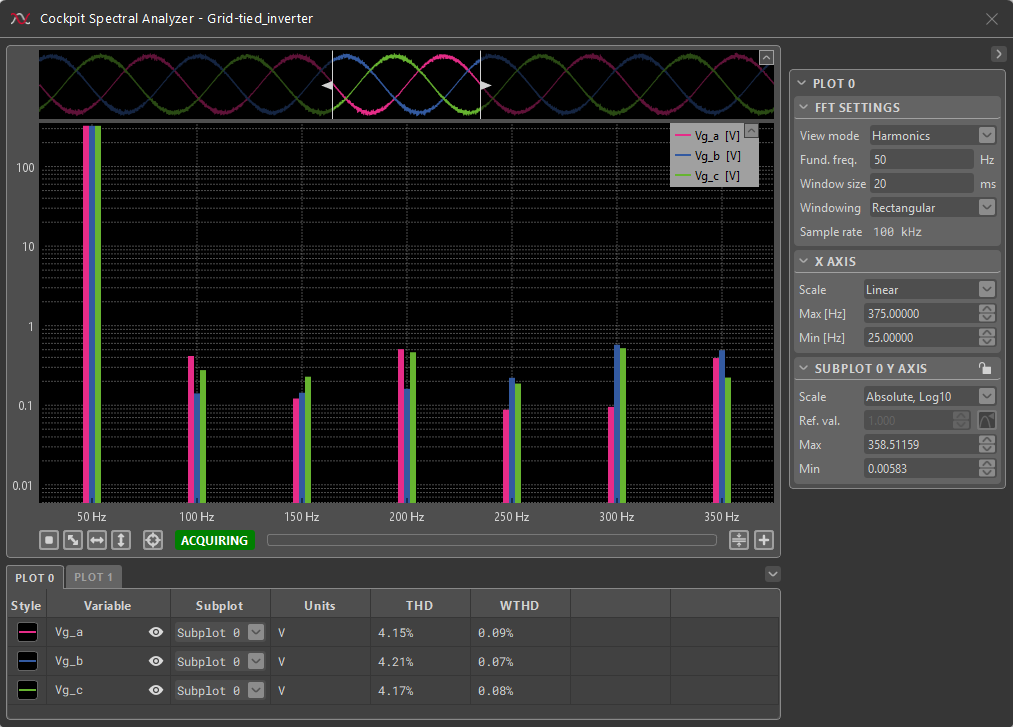
Technical details
THD is defined as ratio of the root-mean-square of the harmonic content and the fundamental frequency, typically taken to be 50 or 60 Hz. In the Cockpit Spectral Analyzer, THD is calculated according to the following formula:
\(\text{THD}=\frac{1}{V_1}\sqrt{\overset{\infty}{\underset{i=2,3,\dots}{\sum}}V_i^2}\),
where \(V_1\) is the amplitude of the harmonic at the fundamental frequency and \(V_i, i\in\{2,3,\dots\}\) are the amplitudes of the harmonics at the \(i\)-th multiple of the fundamental frequency.
WTHD is calculated in a similar manner, except the harmonics are weighted to be inversely proportional to their order:
\(\text{WTHD}=\frac{1}{V_1}\sqrt{\overset{\infty}{\underset{i=2,3,\dots}{\sum}}(\frac{V_i}{i})^2}\)
Spectral Analyzer tips and tricks
- To zoom in and out along the horizontal axis, place the mouse cursor where to zoom. Then, use the mouse wheel to zoom in or out around the location of the mouse cursor.
- To zoom in and out along the vertical axis, place the mouse cursor where to zoom. Then press the ctrl key and use the mouse wheel to zoom in or out around the location of the mouse cursor.
- To zoom on a specific area, click and drag to draw a blue rectangle over the zoom area.
- To achieve a horizontal autoscale, right-click and drag horizontally. A light grey horizontal strip will appear. Release the mouse button to perform the horizontal autoscale.
- To achieve a vertical autoscale, right-click and drag vertically. A light grey vertical strip will appear. Release the mouse button to perform the vertical autoscale.
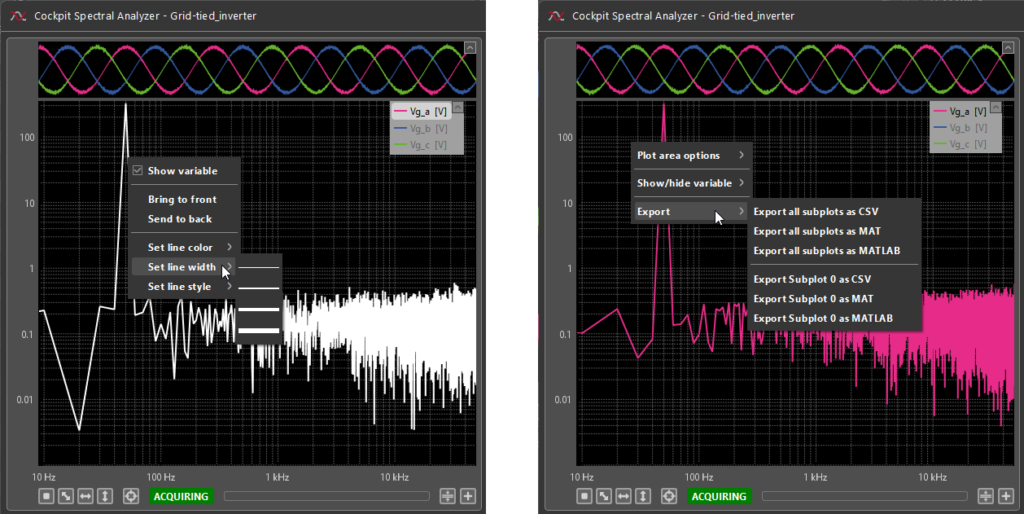
- Even though the Spectral Analyzer is not available in the Import/Export tab, spectral plots can still be exported through the subplot context menus by right-clicking on the empty space in the plots.
- Other Spectral Analyzer functionalities can also be accessed through through context menus by right-clicking on a plotted variable or on the empty space in the plots.