Table of Contents
This article describes how to use the XY plot module of imperix Cockpit to interact with the user code running on imperix controllers, namely the B-Box 4, the B-Box RCP, the B-Board PRO, the Programmable Inverter and the B-Box Micro. This page provides a detailed explanation of the module’s features.
For new users, it is recommended to read the following articles beforehand to get started with the imperix software development kits (SDKs) and the Cockpit monitoring software:
XY Plot basics
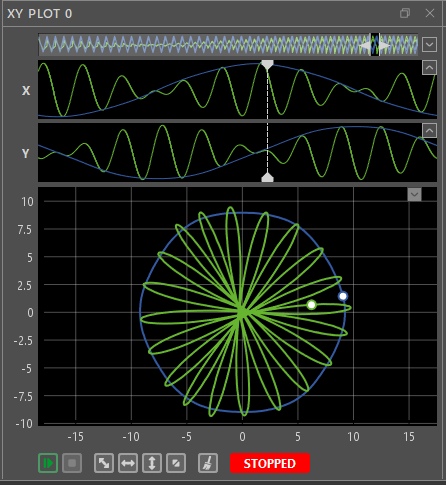
The XY plot module allows for visualizing the relationship between two variables by plotting one against the other in a two-dimensional plane. This is particularly useful for analysing current trajectories in motor control, Maximum Power Point Tracking (MPPT) characteristics, or phase-current relationships in multilevel converters.
The sampling frequency of the XY plot can range from 10Hz up to the CPU control task frequency. The maximal amount of the recorded data depends on this value and the number of acquired variables. Once the allocated memory buffer fills up, the oldest acquired points are automatically disregarded.
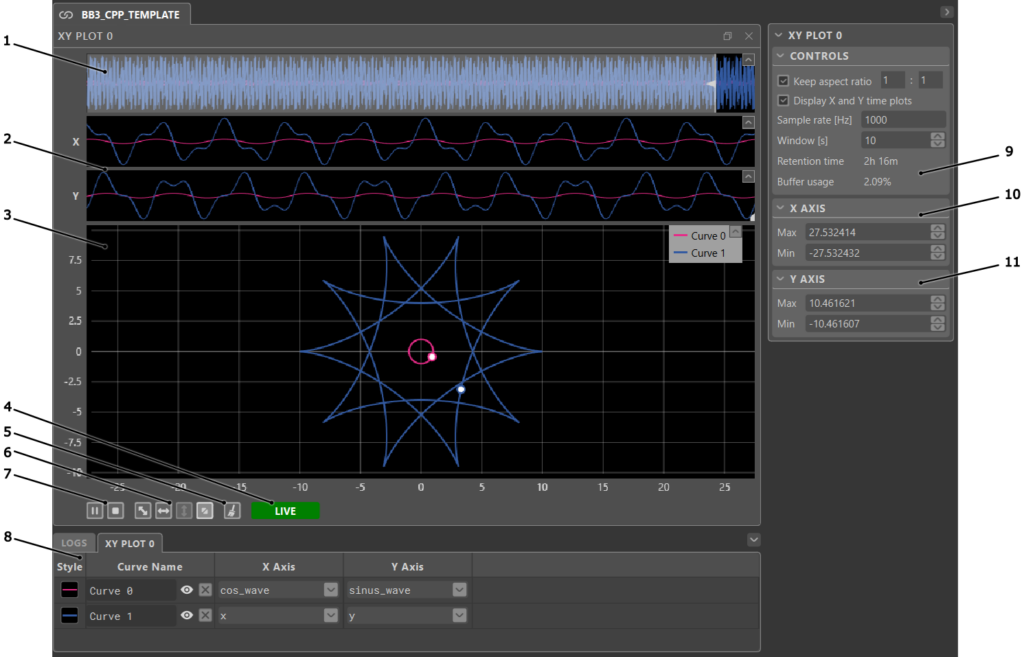
XY Plot interface
XY Plot tips and tricks
- To add a curve to the XY plot, open the user variable section of the project pane. Variables can be added one by one: the first variable will create a new curve and be assigned as the X value, and the second variable will complete the curve by being assigned as the Y value. Alternatively, multiple variables can be added at once by holding Ctrl while clicking to select individual variables, or by holding Shift to select a range of variables. The first selected variable becomes X and the second becomes Y. If more than two variables are selected, multiple curves will be created following the same logic (3rd and 4th variables create a second curve, etc.). The bottom bar can also be used to change the X and Y axis variables directly for each curve.
- To inspect specific data points, pause or stop the acquisition and move the cursor along the time axis in the X or Y time plots. A marker on the XY plot will follow, indicating the corresponding position on the curve.
- To zoom in and out, place the mouse cursor where to zoom. Then, use the mouse wheel to zoom in or out around the mouse cursor. Both axes are zoomed simultaneously.
- To zoom on a specific area, click and drag to draw a blue rectangle over the zoom area. When Keep aspect ratio is enabled, the zoom may not perfectly match the selected area, but will approximate it as closely as possible while maintaining the configured ratio.
- To achieve a horizontal autoscale, right-click and drag horizontally. A light grey horizontal strip will appear. Release the mouse button to perform the horizontal autoscale.
- To achieve a vertical autoscale, right-click and drag vertically. A light grey vertical strip will appear. Release the mouse button to perform the vertical autoscale.
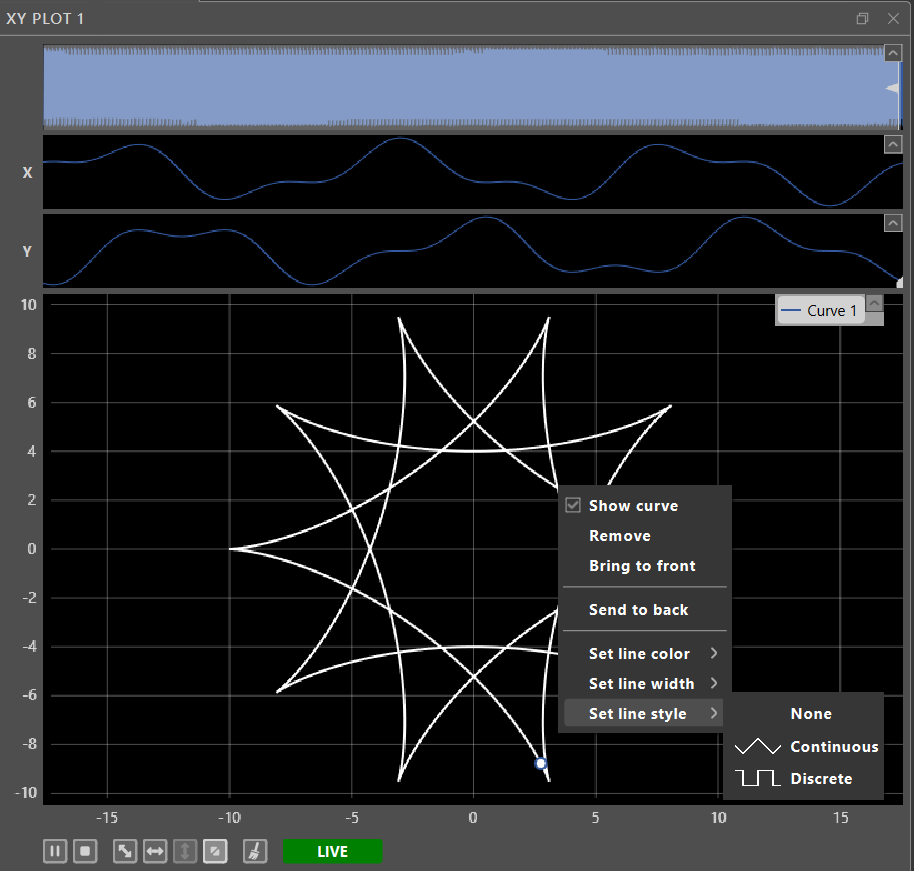
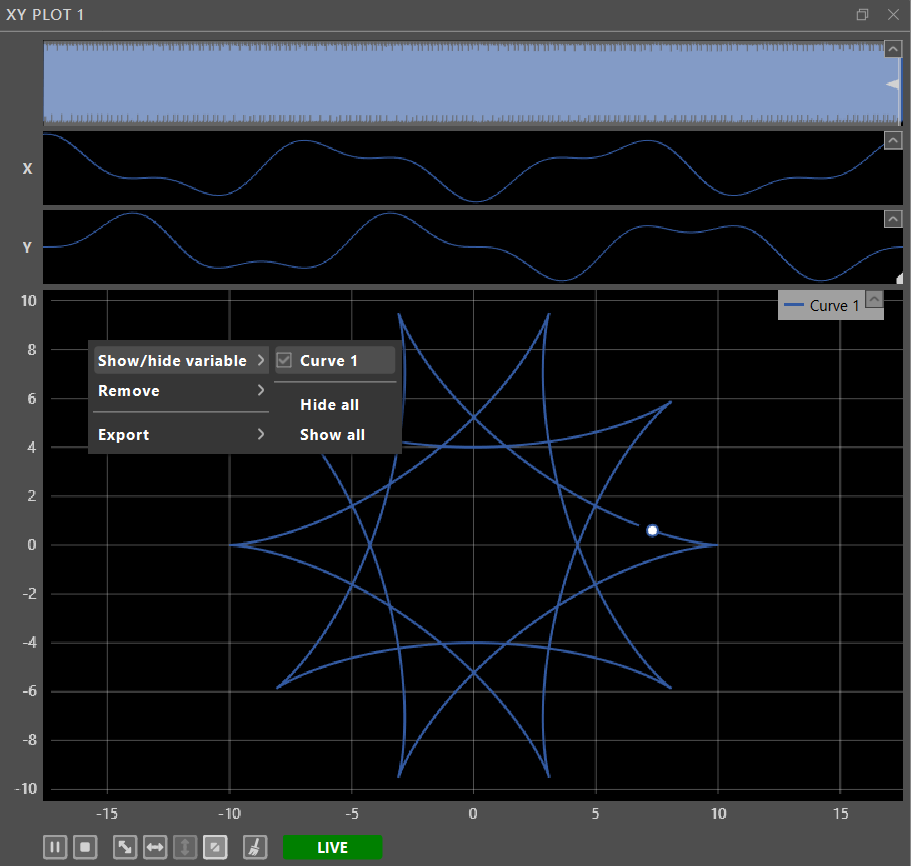
- Many of the XY plot functionalities can also be accessed through context menus by right-clicking on a plotted curve or on the empty space in the plots.
XY Plot application examples
The following examples illustrate typical use cases of the XY Plot module:
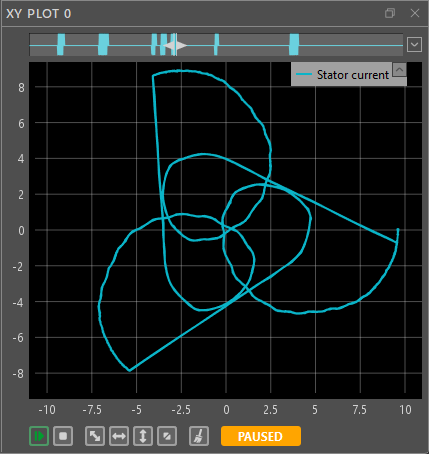
- Stator current trajectory during a motor homing sequence. The pattern shows the current vector as the rotor position is aligned by the control. Further details are provided in Field-Oriented Control of PMSM.
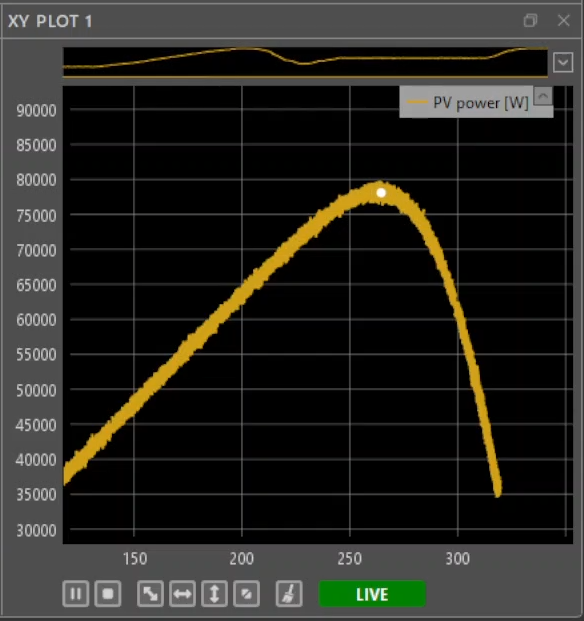
- Power-voltage (P-V) characteristic of a photovoltaic string. The curve shows the MPPT algorithm reaching the maximum power point. Further details are provided in Maximum Power Point Tracking (MPPT).
- Current trajectory of an MMC inverter with low fundamental frequency and harmonic current injection. The X and Y time plots show the evolution of the αβ-axis circulating currents.