This note explains how to build, load, and execute the control code that is generated from Simulink, PLECS or imperix IDE (C/C++ code). It notably details how to connect the target to the host computer, using the monitoring software BB Control.
From release v.3.7 of both ACG SDK and CPP SDK, BB control has been discontinued.
Please visit Programming and operating imperix controllers instead.
BB Control has been replaced by imperix Cockpit, which offers an extended set of features and a superior user experience. To learn more please visit the Cockpit user guide page.
Related content
With Simulink
With PLECS
With imperix C++ SDK
Related video
Generating run-time code
To generate the code and load it to the B-Box RCP or B-Board PRO controller, the procedure is as follows:
Simulink
Make sure that “Automated Code Generation” is selected in the Configuration block of the model, and click the “Build” button (Ctrl+B).
PLECS
Open the “Coder > Coder option” window (Ctrl+alt+B) and click the “Build” button.
C/C++
Click on the “run” icon within the imperix IDE.
Loading and executing code
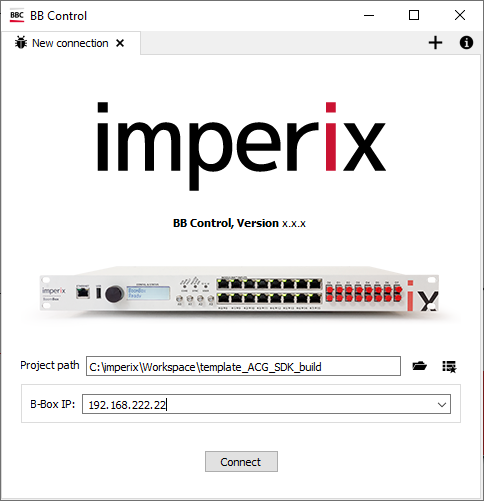
After a code has been successfully built, if BB Control is not running yet, it will be automatically launched. At first launch, the target IP address must be entered indicated before connecting to the target. Once connected, the code is started automatically. From the second launch, BB Control tries to connect to the last used IP address. Alternatively, BB Control can be launched from the Windows start menu, in which case the user must indicate the path to the project folder, as well as the target IP address (see fig. below).
By clicking the “Connect” button, BB Control connects to the target and loads the executable. Project settings (including the IP address and project path) are then written in a configuration file named ‘config.dxv’ and stored in the project folder. Hence, any future launch won’t hence require any configuration.
Ethernet link configuration
All communications between the target and the computer use the Ethernet port located at the front of the B-Box, or on the carrier board of the B-Board. However, two different scenarios must be distinguished, depending on how the IP address is assigned to the target:
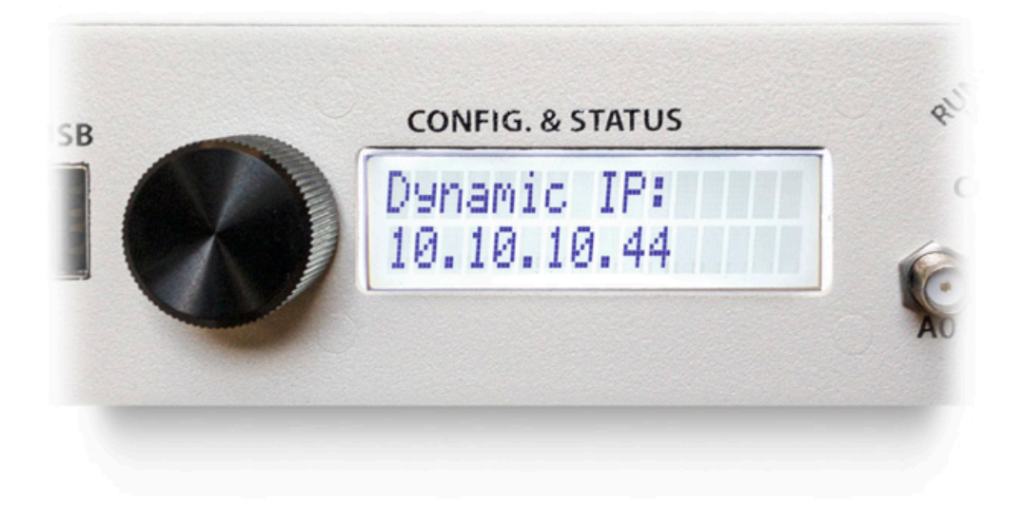
1) The target is part of an Ethernet network and has a dynamic IP address, assigned by a DHCP server. On a B-Box RCP, this address can be seen by simply turning the push button of the front panel at the end of the startup sequence.
With a B-Board PRO, the dynamic IP address can be found using a device browser (e.g. Bonjour browser) and searching for a device with hostname starting with “BB-”.
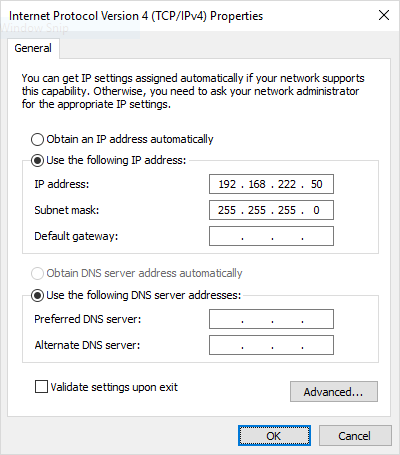
2) The target is directly tied to the host computer and doesn’t receive any dynamic IP address. Therefore, the pre-configured static IP address is used (default value is 192.168.222.22).
In this case, the user must configure the host computer accordingly. To do so:
- Navigate to “Control Panel” > “Network and Internet” > “Network Connections”.
- Right-click on the Ethernet adapter that is connected to the target and select “Properties”.
- Highlight “Internet Protocol Version 4 (TCP/IPv4)” and click “Properties”.
- Check the box “Use the following IP address”, enter the first three bytes of the static IP address of the device, and choose the last byte, different from that of the target. Also, change the network mask to “255.255.255.0”.
Operating the target
Enabling/disabling PWM signals
Right after the connection, BB Control automatically loads and starts the code. However, PWM signals are not physically produced until outputs are enabled.
By default, after the user code is launched, the device is in BLOCKED state (i.e. PWM signals inhibited) for safety reasons. Enabling and disabling the gating signals is done by clicking the “Enable/Disable outputs” button located at the top of the BB Control window.
The enabling/disabling process is completely independent from the control algorithm running and acts as a gating switch on all PWM signals:
Understanding the operating states
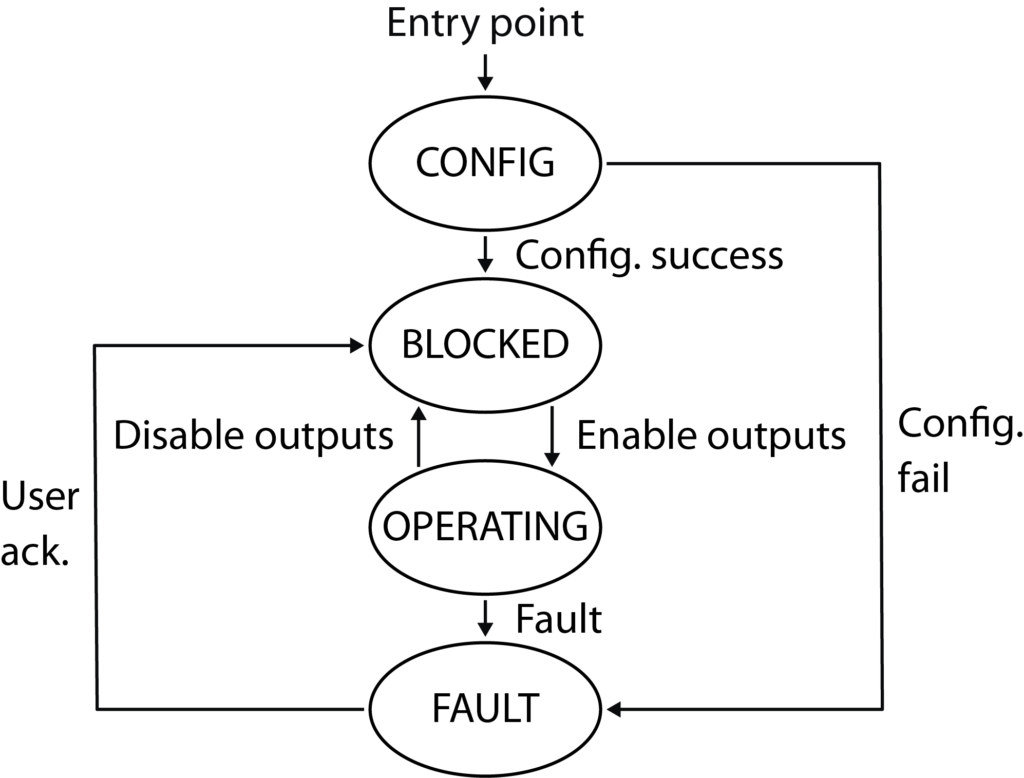
The B-Box RCP and B-Boar PRO have four possible core states:
CONFIG: the system is checking that the resources are correctly configured.BLOCKED: the system is configured correctly and PWM outputs are ready to be enabled.OPERATING: The PWM outputs are enabled, and the system is operating without error.FAULT: An error occurred and the system waits for its acknowledgment.
The controller conforms to the state diagram below. It goes into OPERATING state when the gating signals are enabled, and goes back to BLOCKED state when disabled. In case of error (e.g. due to a hardware fault such as an overcurrent), the controller goes immediately into FAULT, which immediately disables the PWM outputs. The source of the fault is described in the “Message Log” tab of BB Control. The return to the OPERATING mode is only allowed once the fault is cleared and acknowledged.
CONFIG state, are unrecoverable. They mostly result from a misconfiguration and must be resolved before the code can be launched. The most common design issues resulting in unrecoverable faults include:– A physical resource (e.g. analog input) being used by multiple peripherals.
– An excessive interrupt frequency considering the computational complexity of the code.
Faults triggered by the overvalue detection mechanism of the analog inputs can be traced from the front panel. Each analog input has an orange LED that turns on when the measurement triggers the upper or the lower safety limit. The user can use the button on the front panel to navigate through the menus of the screen and get more information about the fault:
– Under “Faults” > “List hardware faults”, the screen indicates which limit was triggered.
– Under “Faults” > “Acknowledge inputs faults”, the user can acknowledge hardware faults.
After hardware faults are acknowledged, the B-Box returns into
BLOCKEDstate.Watching and altering variables
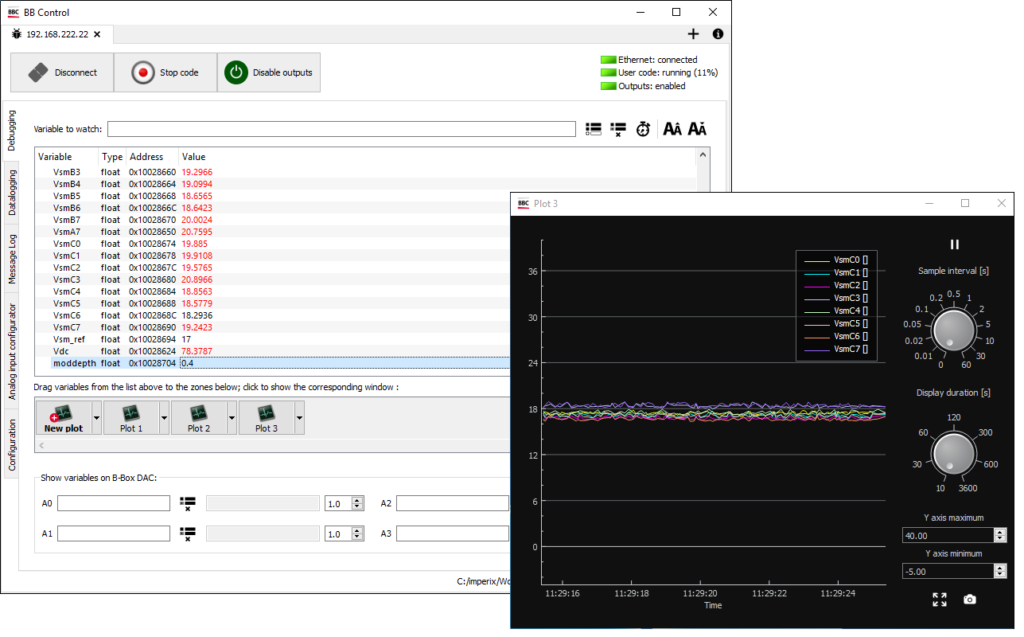
In the “Debugging” tab, variables can be added to the watch list by typing their name in the top field and pressing Enter. Their current value can then be monitored in real-time in the list below. The user can also alter a variable’s value by double-clicking on it (see figure above). Additionally, by dragging a variable from the watch list and dropping it over the plot below, the variable’s evolution in time can be viewed.
float, int32 and uint32.The maximum update rate of this plot is a few tens of Hertz, so this type of plots is only suited to observe the evolution of slow-varying quantities (e.g. DC link voltage). For fast phenomena and/or in order to retrieve consecutive samples, we recommend using the datalogging feature described below.
Data monitoring and logging
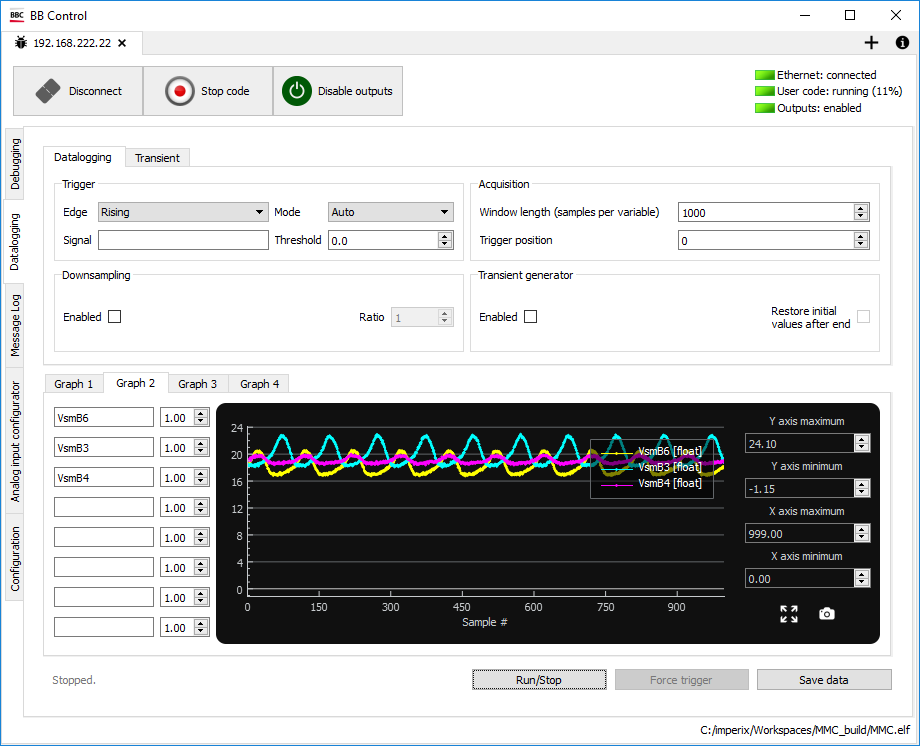
The “Datalogging” tab acts similarly to an oscilloscope. This means that at each control execution step, the variables are logged and made available on the PC at the end of the sampling window. This allows logging each and every sample acquired by the digital controller.
Four different graphs can be used, and up to 8 variables can be plotted on each graph. BB Control can display up to 200’000 points per variable. Different options can be configured, such as the trigger or the gain of the variables.
The trigger can be configured on a signal, using the corresponding parameters on the top left of the “Datalogging” tab, or it can be forced by clicking on “Force trigger”. The variables are displayed on the graphs after each trigger. The sampling frequency is the same as the control frequency. Auto-refresh is available when trigger parameters are configured accordingly.
The “Transient” tab allows the user to schedule events, such as a step of voltage/current reference, that will be applied simultaneously with the acquisition window. In order to be active, the transient generator has to be enabled from the “Datalogging” tab.
Configuring analog inputs
BB Control offers the possibility to read, edit, and save configuration files for the analog front-end of the B-Box RCP. This notably allows switching easily between several configurations, related to different systems. The related information can be found in Analog front-end configuration on B-Box RCP (PN105).
Further monitoring options
On top of the above-described capabilities offered by BB Control, monitoring and logging data can be done using third-party tools and interfaces using either Ethernet or CAN.
Graphical user interface
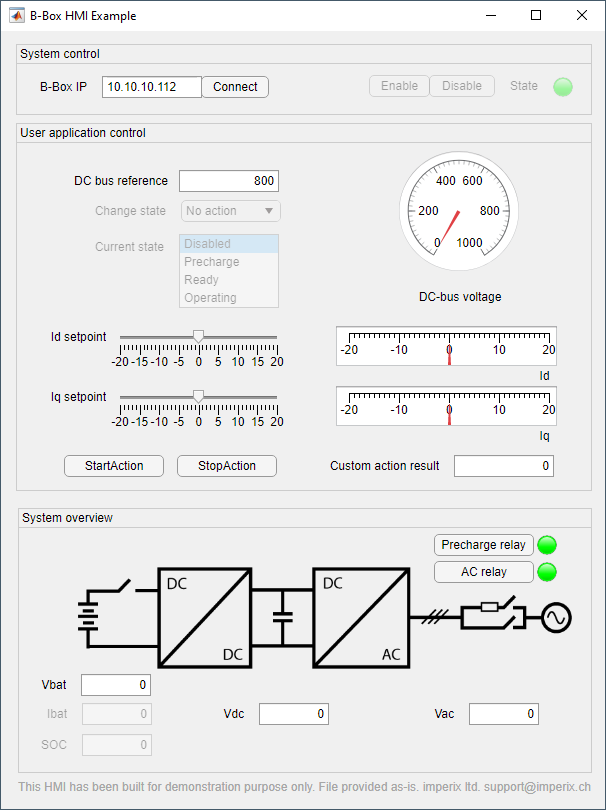
PN130 addresses how to set up a customized graphical user interface using Matlab App Designer.
This approach however requires additional support on the application side, and therefore additional efforts, when compared to the monitoring capabilities that are built-in inside BB Control.
The same communication mechanisms can furthermore also be used when the controller must exchange data with a programmable logic controller (PLC) or a similar platform.


