Table of Contents
This example implements a reduced-scale testbench for electric car motor control.
The application note describes the emulation of the car’s physics with a load motor and the implementation of the car motor speed controller using Field-Oriented Control (FOC).
This note serves also as an example of how pre-recorded setpoint profiles and long-term data monitoring can be used with imperix controllers.
The control is implemented on Simulink using the ACG SDK library and is executed on a B-Box RCP. Please note that imperix offers a ready-to-use motor drive system to develop and test motor control techniques.
Downloads
The Simulink model used in this note can be downloaded under the link below. The same model allows to run a PC-based simulation of the whole system and to generate run-time control code for controlling the motor drives with a B-Box RCP.
Minimum requirements: Imperix ACG SDK ≥3.5.1.1 | MATLAB Simulink ≥R2016a | [offline simulation only] Plexim PLECS Blockset (paid license) or PLECS Viewer (free)
General description of the electric car motor control
In this note, a reduced-scale electric vehicle testbench is implemented by applying common motor control techniques to two connected motor drive systems. In that system, one motor represents the vehicle powertrain, whereas the other produces the resistive force that the moving vehicle is subject to.
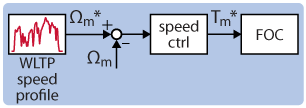
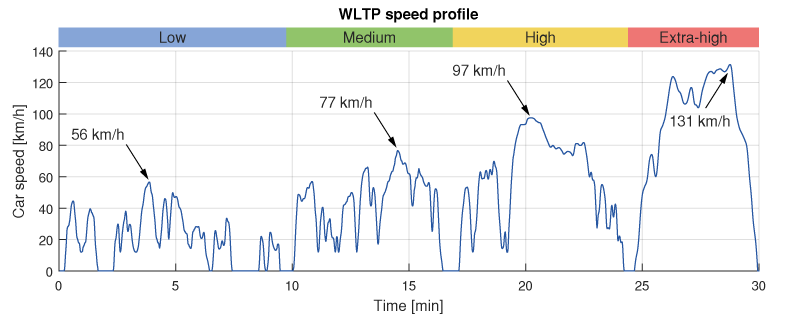
The vehicle powertrain is tested using the standardized WLTP speed profile shown below, which the speed controller has to follow. This realistic test challenges the speed controller in various speed and acceleration ranges. In addition, it allows computing the total electric consumption of the vehicle and the amount of energy recovered during regenerative braking.
Electric car motor control implementation
In this application, one single B-Box controller is used to control both PMSM and, therefore, one single Simulink model implements both control algorithms in parallel. In addition to the motor control algorithms, the model contains notably a car emulator, as described below.
Electric car emulator
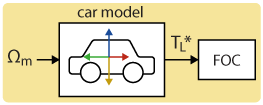
The car emulator computes the resistive torque \(T_L\) that the load machine should apply, in order to mimic the behavior of a moving car. The torque of the load machine is controlled using the method developed in Field-oriented control (FOC) of a PMSM (TN111).
The computation of \(T_L\) is based on a basic physical model containing only an inertial and an air drag term, assuming that the road is flat. The standard equations of linear motion are converted into rotational motion, considering a wheel of radius \(R\). The resistive torque \(T_L\) is computed from the motor speed \(\omega_m\), according to:
$$T_{L}=T_{\text{inertial}}+T_{\text{drag}}=\left(R\gamma\right)^2\left[m\cfrac{\text{d}\omega_m}{\text{d}t}+ \cfrac{1}{2} \mathop{\mathrm{sgn}}(\omega _m) \space R \space \gamma \space \rho_{air} \space C_d \space A \space \omega_m^2\right]$$
with the parameters listed below. Their values are adapted from actual parameters of a Tesla Model S and downsized to fit the ratings of the available motors (1.23 kW / 3.9 Nm).
| Symbol | Parameter | Value |
|---|---|---|
| \(\omega_m\) | Motor speed [rad/s] | Derived from encoder angle |
| \(R\) | Wheel radius | 30 cm |
| \(\gamma\) | Gear box ratio | 1 : 2.5 |
| \(m\) | Mass | 2100 / 120 = 17.5 kg |
| \(\rho_{air}\) | Air density | 1.25 kg/m2 |
| \(C_d\) | Drag coefficient | 0.24 |
| \(A\) | Reference area | 2.34 / 1202/3 = 961.8 cm2 |
Electric car motor control
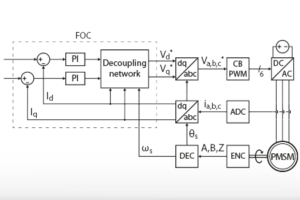
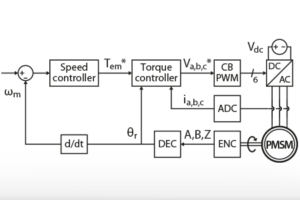
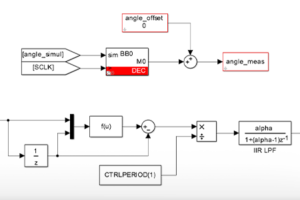
The car motor is controlled to follow a WLTP speed profile using Field-Oriented Control, cascaded with a speed controller. The implementations of both stages are described in TN111 and TN114, respectively. The control orientation is based on the rotor position measured by an incremental encoder and decoded by the decoder module of the ACG SDK library, as presented in Using the angle decoder modules (PN104).
The WLTP speed profile is pre-recorded and stored in a MATLAB vector. During the code execution, it is applied as the speed reference for the car motor controller, using the approach detailed in PN152.
Experimental testbench for electric car motor control
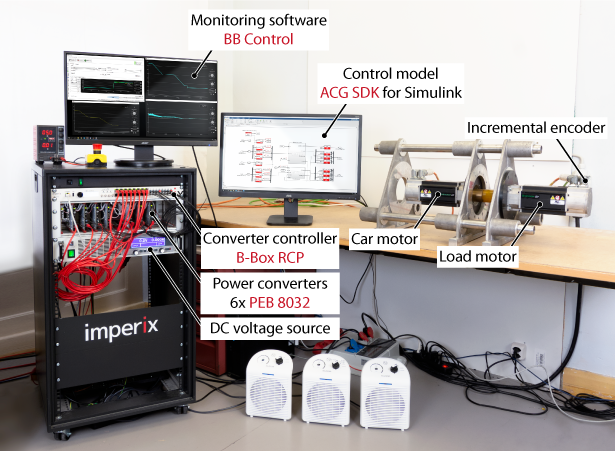
The motor testbench is shown below. It contains two back-to-back 1.23 kW PMSMs, driven by two three-phase voltage source inverters. In this configuration, both inverters share the same DC bus. Please refer to PN180 for more information on this topology.
In particular, the following imperix products are featured:
- B-Box RCP controller
- Control implementation using ACG SDK for Simulink
- Converter rack with 6x PEB 8032 IGBT phase-leg module
Experimental results of the electric car motor control
The following experimental results were extracted from the BB Control datalogging, after running the full 30-minutes WLTP test. The speed, torque, and electrical power values of each machine are acquired at a rate of 10 Hz (i.e. using a downsampling ratio of 2000). In total, 18’000 samples of 7 different variables are acquired and exported in a CSV file.
Speed control
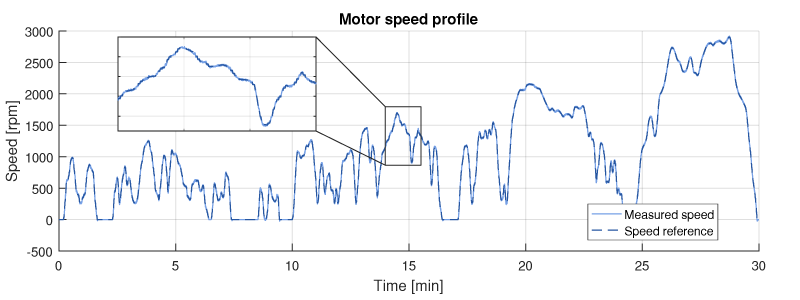
The following graph shows the measured motor speed during the whole 30-minutes test. It shows that the speed regulator is able to track the WLTP speed profile throughout the test, in all speed ranges.
Motor torque and load forces
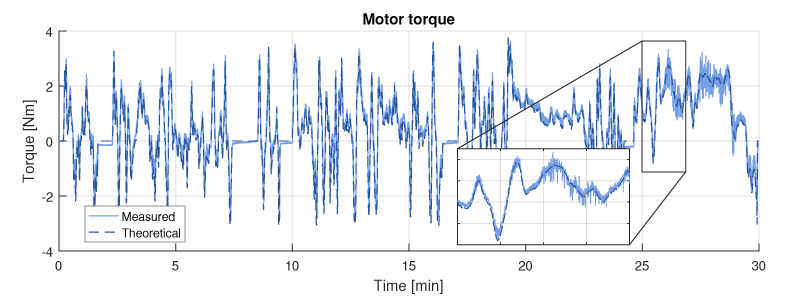
The graph below shows the evolution of the motor torque throughout the test. The measured torque is actually estimated from the q-axis current of the PMSM, while the theoretical value is derived from the speed profile and the physical model of the car. Overall, the measured torque tends to be slightly larger (in absolute value) than the theoretical value, since the motor friction forces are not taken into account in the car modeling.
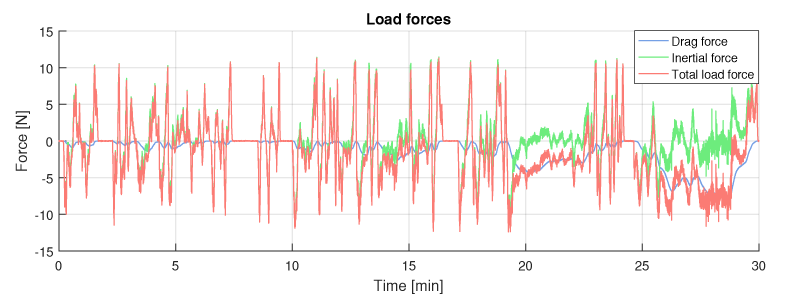
When translated back into linear movement, the load torque breaks down into its air drag and inertial components, as shown below. As expected, the drag force is always negative, since it acts always against the movement of the car. The inertia, however, acts against acceleration: its associated force is negative when the car accelerates, and positive when it decelerates. Overall, when the total load force is positive, the kinetic energy can be recovered to charge the car battery, thanks to the bidirectional power converter. In the case of this back-to-back testbench, the load machine runs as a motor during the energy recovery periods.
Power consumption and energy regeneration
Energy recovery can be illustrated even more clearly when plotting the evolution of the motor electrical power, as in the figure below. When the motor power becomes negative, the power flow is inverted and the power excess is transferred back towards the DC bus of the converter. This is the case when the drag force is not sufficient to slow down the car and the speed controller has to brake (i.e. impose a negative torque) to be able to follow the speed reference. This corresponds to regenerative braking.
In real terms, the speed controller of this testbench is similar to the behavior of the car driver that uses one-pedal driving.
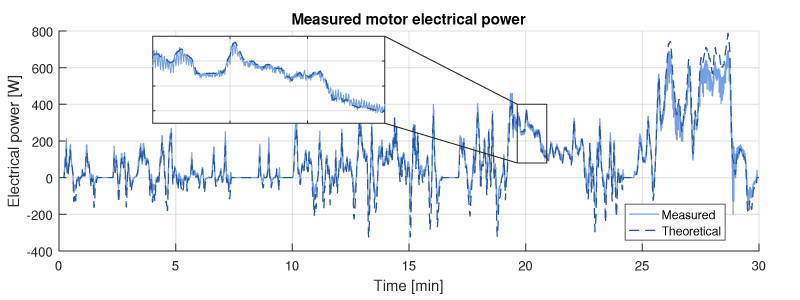
In terms of energy consumption during the test, the integration of the electrical power gives the following energetic figures:
| Consumed energy [Wh] | 71.3 |
| Regenerated energy [Wh] | 5.2 |
| Energy balance [Wh] | 66.1 |
| Recovered energy ratio [%] | 7.3 |


