Table of Contents
Droop control algorithms are utilized to wirelessly regulate the power-sharing among grid-forming inverters (GFMIs) in microgrids, regardless of whether they operate in standalone or grid-connected mode.
This technical note introduces the proportional droop control and provides an implementation example featuring the programmable inverter TPI 8032 and ACG SDK.
Introduction to proportional droop control
Proportional droop control enables automatic decentralized power-sharing and independent control of active (P) and reactive (Q) power among parallel GFMIs operating in a microgrid, to keep the grid voltage and frequency under control. Droop control feedbacks only those variables that can be measured locally at the inverter, thus it does not need communication of control signals between the GFMIs to work, improving the microgrid reliability [1].
Frequency regulation is essential for grid stability. Standards and regulations define acceptable limits for the maximum allowed voltage \(V\) and frequency \(\omega\) variations, as well as its rate of change (RoCoF), to keep changes within safe bounds [2]. Therefore, there is a need to slow down the dynamics of GFMIs to avoid abrupt frequency and voltage variations.
An overview of a proportional droop control is presented in the following figure. The proportional droop control is usually implemented as the outer loop of a cascaded AC voltage control, addressed in TN168. The outer loop consists of an active power control (APC) and a reactive power control (RPC). The outer loop presents a lower bandwidth, achieved with low-pass filters (LPFs), to let the inner loop follow the reference voltage vector provided by the outer loop.
Power transmission in a line
A symmetrical three-phase transmission line is represented in the following figure with its single-phase equivalent to study the power flow [1].
Considering the power converter as an ideal controllable voltage source that is connected to the mains through a generic line impedance \(Z_{l}\), the active \(P\) and reactive \(Q\) powers can be expressed as [1]:
$$P=\cfrac{V_1}{R_{l}^2+X_{l}^2}\left\lbrack R_{l}\left(V_1-V_2\cos\delta\right)+X_{l}V_2\sin\delta\right\rbrack$$
$$Q=\cfrac{V_1}{R_{l}^2+X_{l}^2}\left\lbrack X_{l}\left(V_1-V_2\cos\delta\right)-R_{l}V_2\sin\delta\right\rbrack$$
where \(V_{1}\) is the converter voltage, \(V_{2}\) is the grid voltage, \(\delta\) is the phase angle between the voltages \(V_{1}\) and \(V_{2}\), \(R_{l}\) and \(X_{l}\) are the resistive and reactive part of the line impedance.
These two expressions can be simplified by considering two assumptions:
- The first one regards the phase angle δ: if the phase angle is small enough, then the sine of the angle can be approximated to the angle itself. Hence, \(sin(δ)\approxδ\) and \(cos(δ)\approx1\).
- The second assumption concerns the nature of the line impedance \(Z_{l}\): if the line is mostly inductive, \(R_{l}\ll X_{l}\).
Then, the resulting active and reactive power can be expressed as [1]:
$$P\approx\cfrac{V_1V_2}{X_{l}} \delta$$
$$Q\approx\cfrac{V_1\left(V_{1-}V_2\right)}{X_{l}}$$
The equations show that active and reactive power flows are decoupled when these two assumptions hold, thus independent control of P and Q power flows is possible. The active power flow depends mostly on the phase difference between the line voltages, while the reactive power flow depends on the difference in the voltage amplitude.
Droop curves
The proportional droop control owes its name to the droop curves, also referred to as droop characteristics, implemented in the control strategy. The droop curves express how each GFMI should adjust its frequency and voltage in response to fluctuations in load demand. By providing slow dynamics and predefined droop curves, droop control avoids conflicts between multiple GFMIs operating in parallel and controlling the same grid voltage. Each GFMI can be automatically adjusted until grid stability is obtained.
The active power control (APC) droop curve links active power and frequency (P −ω). The frequency indirectly controls the phase. Furthermore, the reactive power control (RPC) droop curve links the reactive power and voltage amplitude (Q−V). In this case, reactive power variations directly influence the voltage amplitude. The APC and RCP linear relationships can be expressed as below [3]:
$$\omega^{*}=\omega_0-mP$$
$$V^{*}=V_0-nQ$$
where \(m\) and \(n\) are the static droop coefficients for the frequency and the voltage amplitude, whereas \(V_{0}\) and \(\omega_{0}\) are the voltage amplitude and frequency at nominal values, respectively. The static droop coefficients are designed to ensure the steady state maximum variation for the voltage amplitude and the frequency and can be calculated as follows [3]:
$$m=\frac{\triangle\omega}{P_{\max}}$$
$$n=\frac{\triangle V}{Q_{\max}}$$
The droop equations can be represented graphically, as shown in the following figure, where the static droop coefficients are the slopes of the lines.
Implementation of proportional droop control
Active power controller
The structure of the APC is depicted in the figure below [3].
The low-pass filter (LPF) is introduced to slow the control dynamic and meet the maximum RoCoF requirement. To have the maximum allowed RoCoF \(\rho\) for the maximum active power \(P_{max}\), the delay \(τ_{LPF}\) that should be introduced by the low pass filter can be calculated as [4]:
$$\tau_{LPF}=\frac{m}{\rho}P_{\max}$$
where \(m\) is the active power droop coefficient. Moreover, a high-pass filter (HPF) is introduced to restore the nominal frequency in an islanded grid. To clarify this, the droop characteristic can be expressed as:
$$\omega_{ref}=\omega_{0}-mLPF(s)HPF(s)P$$
This way, when \(P\) is constant (in steady-state), the second part of the equation becomes 0 and \(\omega_{ref} = \omega_{0}\).
Reactive power controller
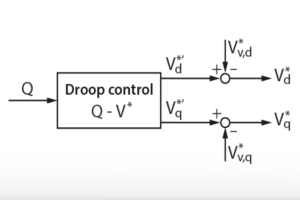
The structure of the RPC is depicted in the figure below [3].
The HPF is unnecessary in the reactive power controller since there is a direct relationship between the voltage amplitude and the reactive power, which is not the case with the APC. Again, the LPF slows down the control dynamics.
Experimental validation of a proportional droop control
Software resources for proportional droop control
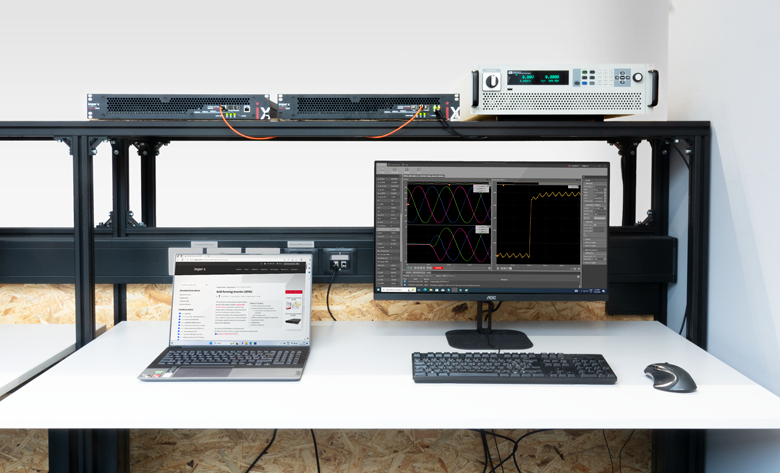
The control models available here after are implemented in Simulink using the imperix ACG SDK blockset. The models can both simulate the behavior of the system in an offline simulation and generate code for real-time execution on the controller of TPI 8032. An introductory guide regarding the TPI is addressed in PN190. To run these models, the minimum requirements are:
- Imperix ACG SDK 2024.2 or newer.
- MATLAB Simulink R2016a or newer.
- For simulation only: Simscape Electrical
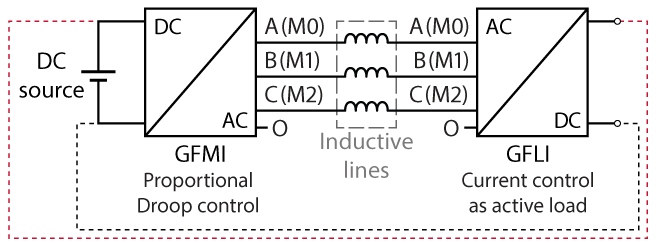
- TN169_GFMI_Proportional_droop_control includes the grid-forming inverter proportional droop control connected to a passive load through an inductive line. This implementation requires one TPI 8032.
- TN169_GFMI_and_GFLI_Proportional_droop_control includes a grid-following inverter as an active load connected through an inductive line. This implementation requires two TPI 8032.
The active and reactive power controls are implemented in Simulink as follows:
Experimental results
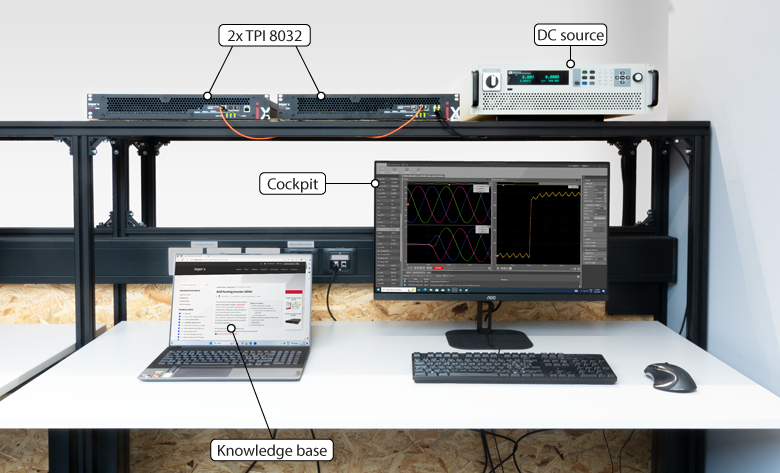
The experimental validation of the proportional droop control is carried out with two TPIs used in a master-slave configuration, meaning that they are programmed from the same Simulink model. The proportional droop control is implemented on the master unit, connected through an SFP cable to the slave GFLI unit acting as an active load. Therefore the required equipment is:
- 2x TPI 8032 three-phase inverter
- ACG SDK toolbox for automated generation of the controller code from Simulink or PLECS
- 1x bidirectional DC power supply (800V)
- 3x 2.2mH inductors
- All the necessary cables
The maximum allowed frequency and voltage variations are chosen as \(\triangle\omega_{pu}=1\%\) and \(\triangle V_{pu}=10\%\):
$$\triangle\omega_{pu}=1\%\to\triangle\omega=2\cdot\pi\cdot50\cdot\frac{1}{100}=3.14\,\text{rad/s}$$
$$\triangle V_{pu}=1\%\to\triangle V=230\cdot\sqrt2\cdot\frac{10}{100}=32.5\,\text{V}$$
The RoCoF depends on the amplitude of the load step and the LPF used in the proportional droop control. For a maximum allowed RoCoF of \(\rho=1 Hz/s\), the cut-off frequency of the LPF should be:
$$\tau_{LPF}=\frac{m}{\rho}P_{\max}=0.5\,\text{s}\rightarrow w_{c_{-}LPF}=0.318\,\text{Hz}$$
| Parameter | Value |
|---|---|
| Control and switching frequency | 50 kHz |
| Maximum active power P Maximum apparent power S Maximum reactive power Q | 18 kW 22 kVA 12.6 kVar |
| Grid Voltage DC voltage maximum RoCoF \(\rho\) | 230 VRMS 800 V 1 Hz/s |
| \(\triangle f\) (1%) \(\triangle V\) (10%) | 3.14 rad/s 32.5 V |
| Line inductance | 2.2 mH |
| APC droop coefficient m APC – LPF cut-off frequency APC – HPF cut-off frequency RPC droop coefficient n RPC – LPF cut-off frequency | 1.745e-04 0.3 Hz 5 Hz 0.0026 2 Hz |
The rating of the power converter is 22 kVA. Since the maximum active power \(P\) is chosen as 18kW, the derived maximum reactive power is \(Q=\sqrt{(S^2-P^2)}=12.6\,\text{kVar}\).
Two consecutive tests are conducted to verify the effectiveness of active and reactive power controls. In the first test, an 18kW active power step is applied to the GFMI via GFLI in t=100ms. In the second test, a reference reactive power step of 12kVar is applied in t=100ms.
The resulting reference current for the GFLI current control is generated in an open-loop manner as follows.
$$I_{m,d}^{\star}=\frac{P^{\star}}{V_{d}}\cdot\frac23-V_{q}\omega C_{f}$$
$$I_{m,q}^{\star}=-\frac{Q^{\star}}{V_{d}}\cdot\frac23+V_{d}\omega C_{f}$$
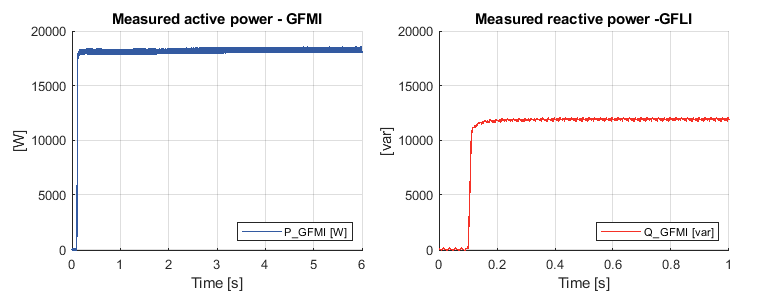
The measured active and reactive powers reach the steady state condition without overshoot. The settling time for the active and reactive power is \(\approx\) 50ms. The resulting frequency variation and voltage drop are shown in the following figure.
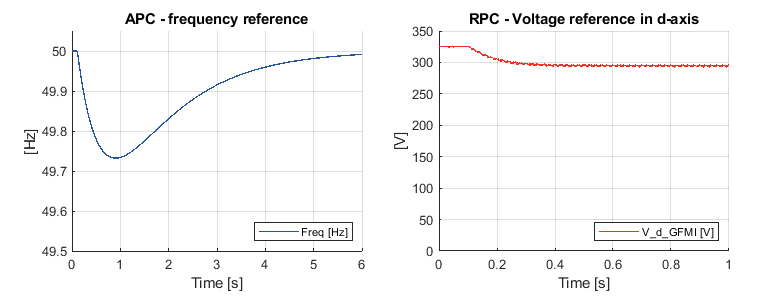
The distortion in the active power does not affect the frequency variation because of the LPF used in the active power droop control. Both the RoCoF and the minimum frequency during the transient, namely 0.82Hz/s and 49.74Hz, are within the imposed limitations. Moreover, the frequency returns to the nominal value in \(\approx\) 6s.
Finally, the voltage drop in the reactive power control is 30.7V, corresponding to a 9.4% variation, which is within the maximum allowed 10% voltage variation.
To go further…
In the case of a resistive line, the assumption of an inductive line for P and Q decoupling is no longer valid. To this end, a droop control with virtual impedance can be implemented to decouple P and Q.
To address the lack of explicit inertia in the control, the inertial characteristics of synchronous generators can be emulated through a virtual synchronous generator control.
Academic references
[1] K. De Brabandere, B. Bolsens, J. Van den Keybus, A. Woyte, J. Driesen and R. Belmans, “A Voltage and Frequency Droop Control Method for Parallel Inverters,” in IEEE Trans. on Power Electronics, July 2007.
[2] “IEEE Recommended Practice for Monitoring Electric Power Quality”, in IEEE Std 1159-2019, Aug. 2019.
[3] J. M. Guerrero, J. C. Vasquez, J. Matas, L. G. de Vicuna and M. Castilla, “Hierarchical Control of Droop-Controlled AC and DC Microgrids—A General Approach Toward Standardization,” in IEEE Trans. on Industrial Electronics, Jan. 2011.
[4] D. B. Rathnayake, R. Razzaghi, and B. Bahrani, “Generalized virtual synchronous generator
control design for renewable power systems,” in IEEE Trans. on Sustainable Energy, April 2022.


